The other day on Twitter I said this:
This is a topic I’ve briefly looked into in the past, and I’ve posted the results to Twitter, but I deleted all my old tweets at one point and that data is gone, so I figured I’d try to do some work on this question again, and this time I’d put the results somewhere that’s both more thorough and more permanent. It’s widely acknowledged, at least among people who follow hockey statistics, that goaltending performance is subject to a significant element of randomness. This has led some people, including myself, to argue that teams should try to limit their spending on goaltending, since one goalie would seem to be as likely as any other to get good results. In particular, I’ve argued some variation on “Nobody knows who the good goalies are” on many occasions.
If paying more money doesn’t actually get better results in net, then it’s pointless to have a highly priced goaltender, especially in a salary cap system where every dollar spent on one roster spot reduces the amount of money available for each other roster spot. To try to figure out if there’s any benefit to signing a highly priced goalie, the simplest solution is to compare goalie cap hits to goalie results and see what it looks like. So I’ve done that. Some brief notes on methodology before I get to the results.
Methodology
I’ve grabbed the salary cap hit and a variety of goalie stats for every goalie who played at least 30 games in the 2018-19 NHL season. I went back one year because I wanted to look at a season that wasn’t cut short by a pandemic. The 30 game mark doesn’t have anything particularly special about it, except that it seemed to strike a good balance between increasing the sample size of games (so as to not put too much emphasis on goalies who only played a few very good or very bad games) while also having a decent number of goalies in my results. I’ve excluded all goalies on entry level contracts, because what I want to know is whether GMs are paying the right goalies, and ELCs are strictly limited in the NHL’s collective bargaining agreement. I’ve only pulled data for two seasons (we’ll get to the second season in a minute), and there’s no methodological reason for that; it’s just very time-consuming to manually copy contract information from Cap Friendly. Other statistics were pulled from Natural Stat Trick (SV% and HDSV%) and Evolving Hockey (dFSV% and GSAx/60).
Results
The simplest test is whether goalie salary has any relationship to overall save percentage. And it turns out that it doesn’t.
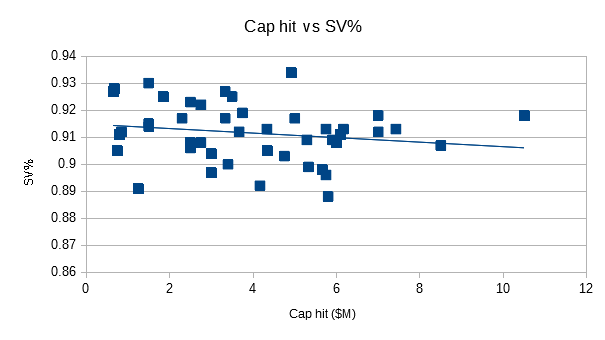
In fact, counterintuitively, the relationship is slightly negative. I’ve also calculated the relationship for a few other stats, including High Danger SV%, delta Fenwick SV% (how much better a goalie did compared to what you would expect based on shot quality), and Goals Saved Above Expected per 60 minutes (another shot-quality adjusted metric). It turns out that the relationship between cap hit and all four of these statistics is slightly negative.
| Stat | R |
|---|---|
| SV% | -0.18 |
| HDSV% | -0.07 |
| dFSV% | -0.15 |
| GSAx/60 | -0.14 |
Hang on a second
But wait, that can’t possibly be right. You get better goaltending by spending less money? That’s when I realised I was making a crucial error. These results are suffering from survivorship bias.
Survivorship bias is a huge problem in evaluating goalies. The crux of it is this: if a goalie’s first handful of games in the NHL are bad, he’s unlikely to get enough chances to show that he’s good enough to stick around. Conversely, if a goalie starts off his career on a hot streak, it can take a while for his numbers to come back to Earth even if he doesn’t keep the hot streak going, and coaches will give him many more chances to prove himself. So what I’ve captured here isn’t that cheaper goalies are better, it’s that the only cheap goalies who manage to stick around for 30 games are the ones who start off on a hot streak.
Thankfully, I think I’ve come up with a better method that will account for that.
Attempt #2
Having identified the problem, how can we fix it? My solution was to expand the time frame and look at two years of results. Because we want to know whether goalies provide better performance after signing a contract, I’ve cut out every goalie from the first group who was not playing under the same contract the previous season (2017-18). This has unfortunately cut the sample size in half (from 45 goalies to 27), but it largely eliminates the problem of goalies coming in on a hot streak that may not represent their true talent.
Additionally, I’ve expanded the results here so that I’m comparing each goalie’s cap hit to their results in both seasons combined. I’ve done this because I wanted to reframe the question a little bit. Even if goaltending results are highly random in any given year, maybe we can pick up more of a signal in all that noise by looking at a longer time span. So, what happen when we compare a goalie’s cap hit to how they performed over the course of two seasons rather than one?
| Stat | R |
|---|---|
| SV% | 0.21 |
| HDSV% | 0.33 |
| dFSV% | 0.31 |
| GSAx/60 | 0.30 |
Well, would you look at that? Suddenly all of the stats are showing some positive correlation, and the three statistics that are a bit more refined are showing even better results than raw SV%.
This lines up with previous research. Back in 2015, Stephen Burtch found that the only difference between highly paid goalies and their lower-priced counterparts was in their HDSV%. It’s also been found previously that HDSV% is the only repeatable part of goaltender talent, and that whether low and medium danger shots go in is almost entirely random (unfortunately this research seems to have been taken offline, so you’ll have to take my word for it).
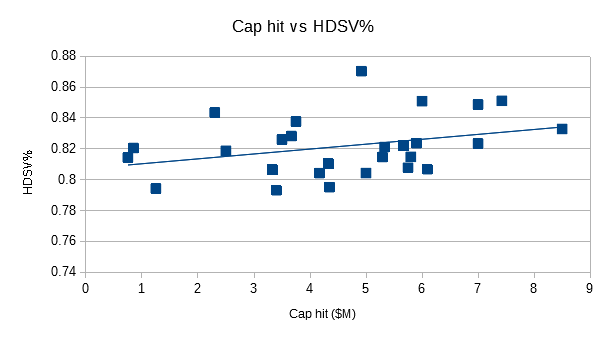
You can see the trend pretty clearly if I put it on a scatter plot.
The trend is even more clear for dFSV% (GSAx/60 looks nearly identical):
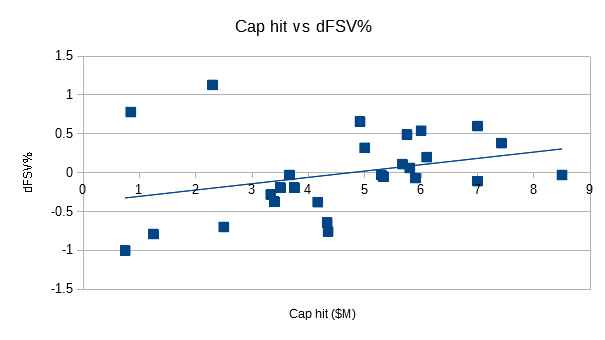
In fact, at this point it looks like the trend is even stronger than our correlations, which hover around 0.3. That’s because there’s one goalie throwing everything off – John Gibson, who was signed to a contract with a cap hit of $2.3M just before he really broke out. With Gibson taken out of the mix, the results change pretty significantly (I do not recommend removing data, this is just to illustrate how much one player is impacting the results here):
| Stat | R |
|---|---|
| SV% | 0.29 |
| HDSV% | 0.40 |
| dFXV% | 0.47 |
| GSAx/60 | 0.48 |
At this point we have a correlation between all of the stats other than raw SV% that I would say is actually not that bad. It’s not a totally linear relationship (some highly paid goalies perform poorly and some inexpensive goalies overperform their contracts), but on the whole there is a clear relationship between how much a goalie gets paid and how well he performs. One thing that I think you can see in the HDSV% plot in particular is that higher paid goalies tend to have a higher floor; there are good results spread out somewhat across the salary spectrum, but the very worst results are always from the least expensive goalies. Perhaps in that sense you could think of a highly paid goalie as a kind of insurance policy against especially bad performance (although nothing, is guaranteed; see Sergei Bobrovsky’s most recent season).
Caveats
There are two main points here that still give me a bit of pause about these results. The first is that, because I’ve only looked at one pair of seasons here, it’s possible that these results are not broadly applicable. Maybe for some reason I just happened to wind up with a pair of years where the trend is much stronger or weaker than you’d get if you looked at many pairs of seasons. As I said previously, there’s no real reason to only look at one pair of seasons except that there’s no easy way to pull salary data other than manually copying it, goalie-by-goalie and year-by-year from Cap Friendly.
The second potential problem is that, in an attempt to get rid of survivorship bias, I may have wound up biasing my results too far in the other direction. What I’ve looked at here can be boiled down to “Are GMs appropriately paying goalies with established track records?”, but that leaves unanswered the question of whether you could get sufficient goaltending from any number of goalies who don’t have established track records. At present I haven’t thought of a good method for answering that question, but if anyone else has I’d love to read it.
Also left untested here is whether there’s more variation in goalie results compared to cap hits relative to players at other positions. I suspect that salary cap spending on forwards is much more efficient and that the value forwards provide is more consistent, but I don’t have evidence to back that hunch up.
Conclusion
With the above caveats noted, at this point I’m prepared to reverse course from my initial statement that cap hits are unrelated to goalie performance, and my related remark that NHL GMs are not very good at identifying who the good goalies are. While there is tremendous variation in goaltending results in the near term, even over a sample as large as a full NHL season, expanding the time frame to two years shows that goalies who are paid more money are providing better goaltending. There is still a lot of variation even over the two year sample, but the results are much better than random. This does not necessarily tell us that teams should spend more money on goaltending (I would need a WAR model to answer that question, not to mention a better sense of the error bars on goalie performance), but it does seem to be generally true that more highly paid goalies provide somewhat superior results.
Leave a comment